How to List of default report templates
CentriQS database has a set of default report templates for the following entities, entity tables and OLAP cubes:
Entity "Task"
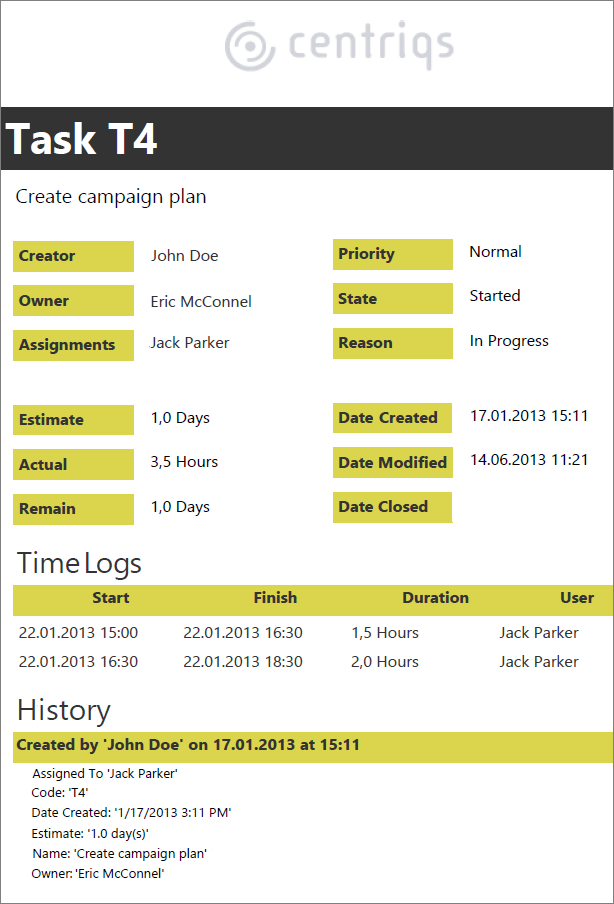
1. Task(s) Detail Information
This report template gathers the most important task properties (code, name, creator, owner, assigned to, priority, state, reason, estimate, actual, remain, deviation, due date, date created, date modified, date closed, project, folder, parent, predecessors, notes) and tables (links, schedule items, time logs, history logs) into one document.
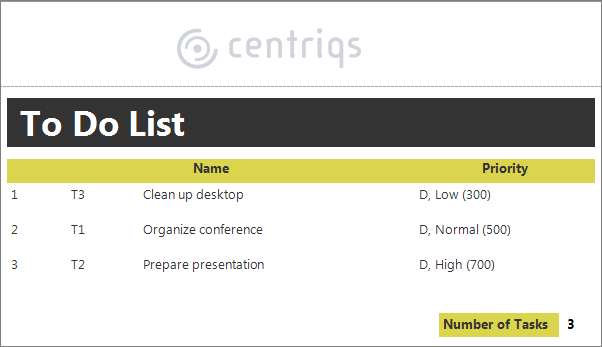
2. To Do List
This report template represents a plain list of tasks with such columns as ‘Code’, ‘Name’, and ‘Priority’. At the right bottom of the to-do list there is task counter ‘Number of Tasks’.
Entity "Project"
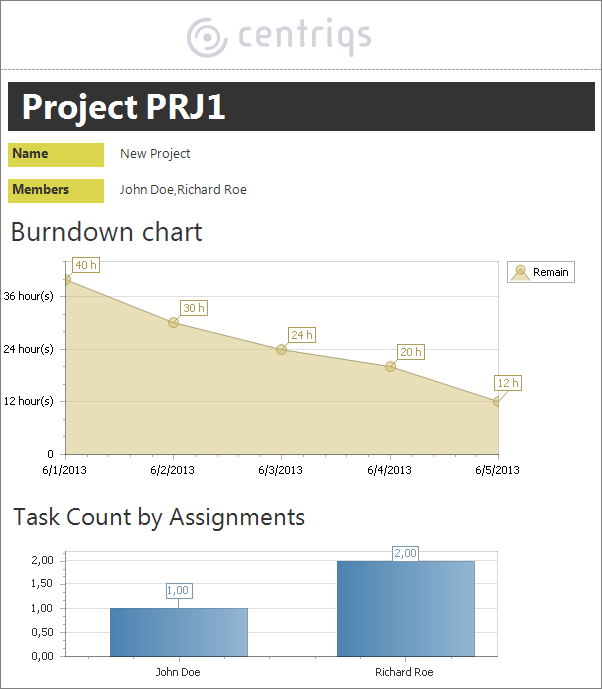
1. Project Dashboard
This report template includes project properties ‘Code’, ‘Name’, ‘Members’ and various project charts like ‘Burndown Chart’, ‘Task Progress by State’, ‘Task Count by State’, ‘Task Count by Assignments’ and ‘Remaining Work by Assignments’.
View ‘Scheduler’
All default report templates for the ‘Scheduler’ view include input parameters that let users set filter by start and finish dates to generate report for a certain time period, and select required resources to generate report for certain users assigned to tasks and appointments.
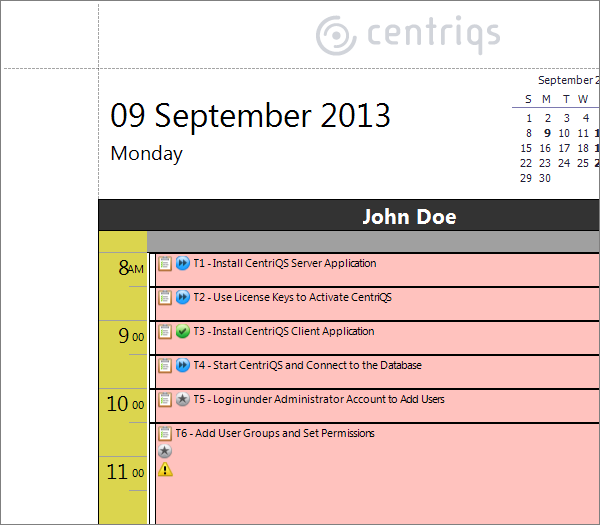
1. Day Schedule
This report template shows one day calendar view per each assigned user per each page.
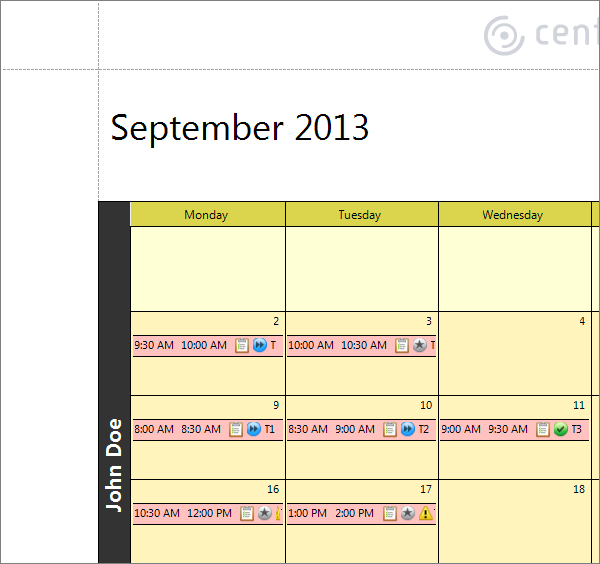
2. Week Schedule (Vertical)
This report template shows one week calendar view per each assigned user per each page in portrait layout.
.png)
3. Week Schedule (Horizontal)
This report template shows one week calendar view per each assigned user per each page in landscape layout.
.png)
4. Month Schedule
This report template shows one month calendar view per each assigned user per each page.
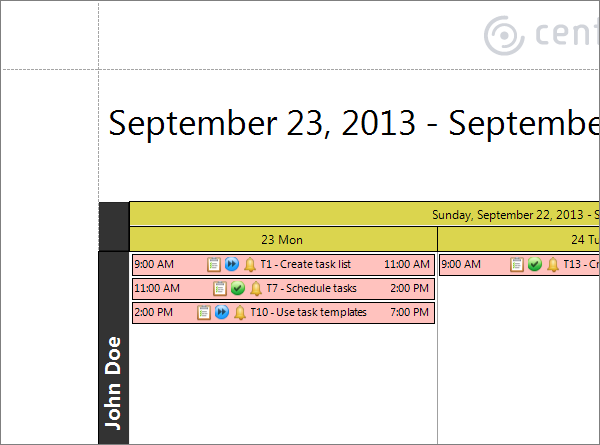
5. Timeline Schedule
This report template shows timeline calendar view per each assigned user (maximum timeline period is 10 days per each page).
OLAP Cube "Task Analytics"
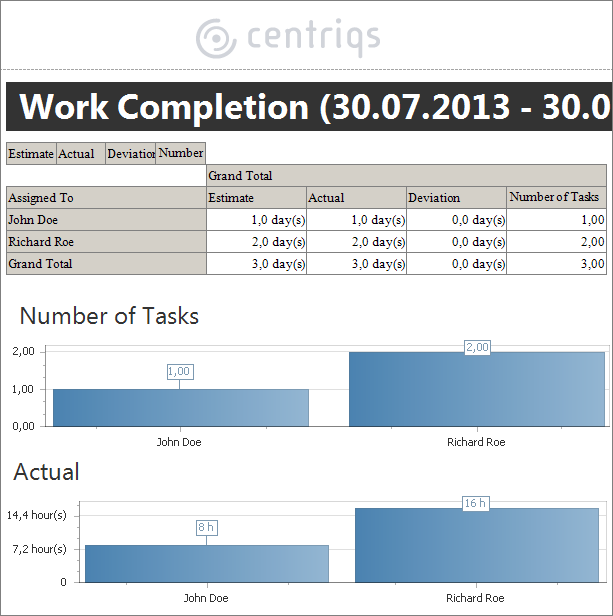
1. Work Completion
This report template consists of task analytics pivot table and charts which show ‘Number of Tasks’, ‘Estimate’, ‘Actual’ and ‘Deviation’ by assigned user. Before generating the report, users should input start and finish date parameters.
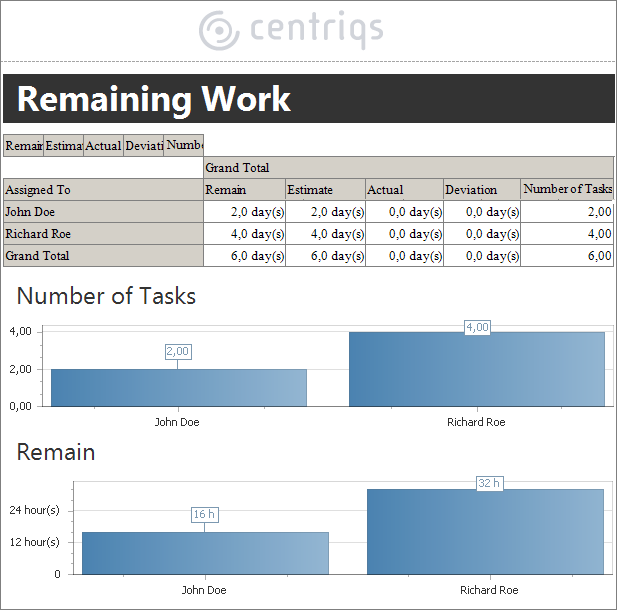
2. Remaining Work
This report template displays task analytics pivot table and charts which show ‘Number of Tasks’, ‘Remain’, ‘Estimate’, ‘Actual’ and ‘Deviation’ by assigned user.