How to Set filter to hide parent tasks
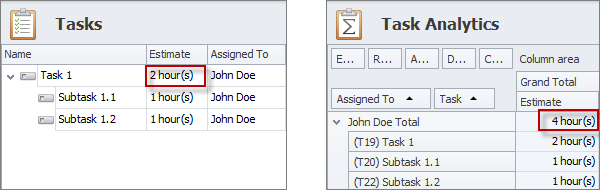
In some cases you have to set filter that hides parent tasks for correct display of task analytic data. The thing is that Task Analytics Pivot Grid and Task Analytics Chart sum up duration of all tasks regardless of their hierarchy.
For example, in the Tasks view task duration is automatically calculated as the summary of its subtasks duration, while in the Task Analytics view task duration is added to subtasks duration.
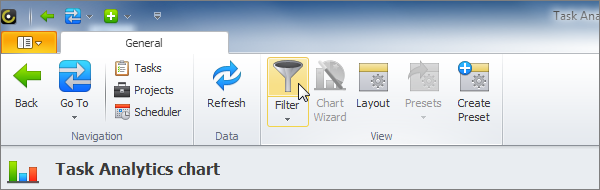
For setting filter in the Task Analytics and Task Analytics Chart views:
- On General tab, in the View group, click Filter.
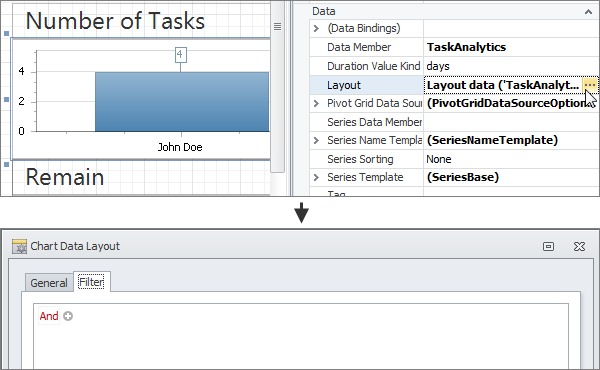
For setting filter in the Reports Designer view:
- Click the pivot grid or chart area to select it, in the Grid Properties pane, in the Data section, click the Layout Data ellipses, and then in the Layout Settings dialog box, click the Filter tab.
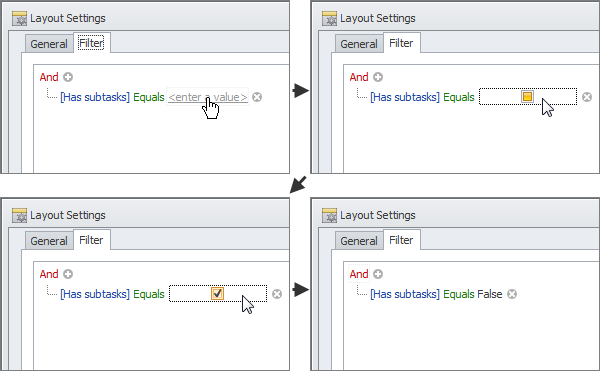
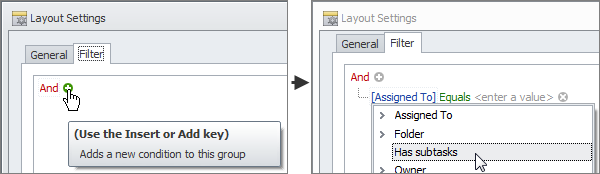
To set filter that hides parent tasks
- Click the Plus icon, click the link in brackets [Assigned To], and then click Has subtasks.
- Click the link in angle brackets <enter a value>, click to select the check box, click to clear the check box, and then click OK.